The plot thickens - Solution
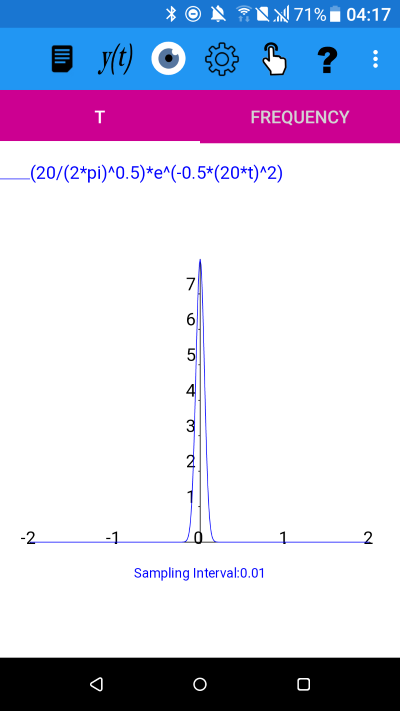
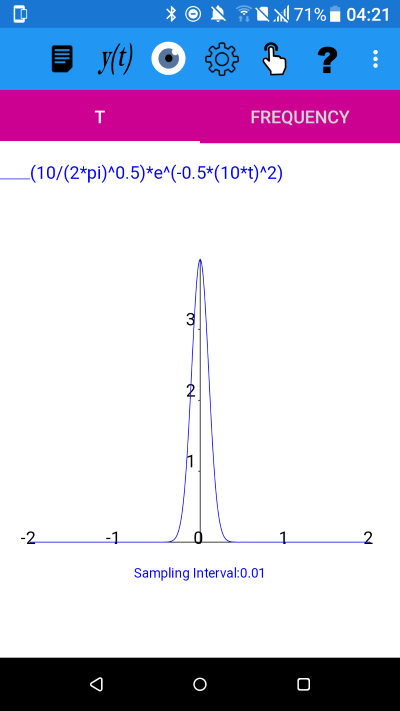
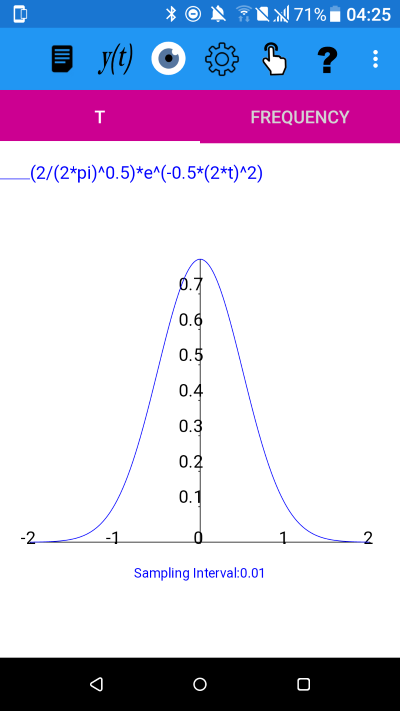
The probability density function of the normal or Gaussian distribution, is:y(t)=(1/(sigma*(2*pi)^0.5))*e^(-0.5*((t-mu)/sigma)^2)
where mu is the mean and sigma the standard deviation.
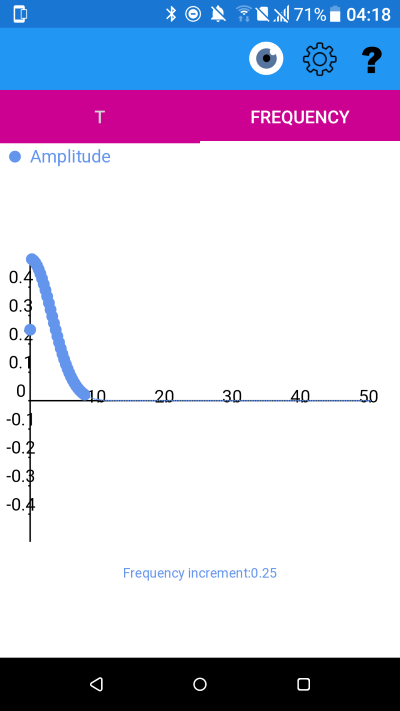
y(t) and amplitude spectrum with mu=0 sigma=0.05
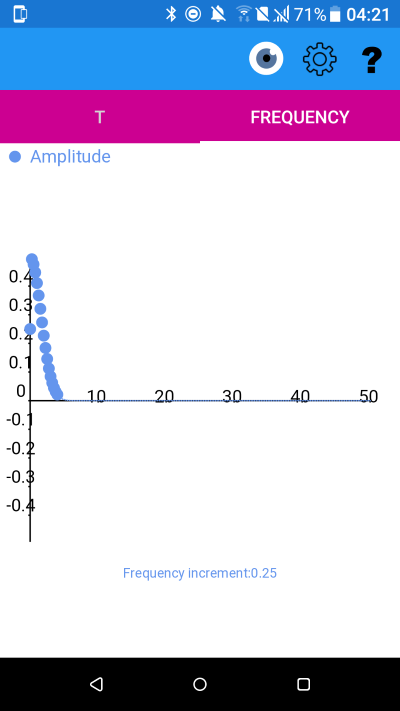
y(t) and amplitude spectrum with mu=0 sigma=0.1
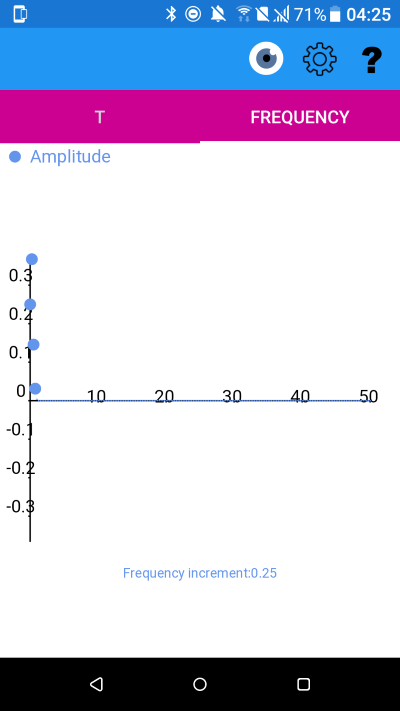
y(t) and amplitude spectrum with mu=0 sigma=0.5
Notice that the spread of frequencies has narrowed as as the spread of the original function has increased.
plotXpose app is available on Google Play and App Store
Google Play and the Google Play logo are trademarks of Google LLC.
A version will shortly be available for Windows.
A version will shortly be available for Windows.
plotXpose app is a companion to the book Mathematics for Electrical Engineering and Computing by Mary Attenborough, published by Newnes, 2003.


