The charging capacitor - Solution
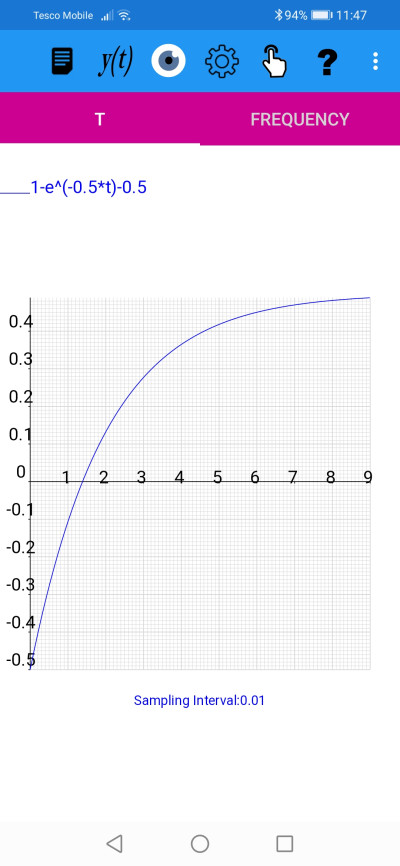
The voltage across a charging capacitor in an RC circuit is given by V=Vo*(1-e^(-t/(R*C))). Vo is the applied DC voltage, R is the resistance and C the capacitance. The product RC is called the time constant.The voltage, V, across a capacitor against time with an applied voltage of Vo=1 and a time constant RC of 0.5 for 0<=t<9 with a sampling interval of 0.01.
a) Use your graph to estimate after how long the voltage has reached half of its maximum value.
The maximum voltage across the capacitor will always be less than the applied voltage in this case Vo=1. On this graph V is represented by the y axis and V approaches 1 as t increases. The maximum voltage is 1 so half the maximum value is 0.5. Using the grid markings, and looking along the y=0.5 line, we can see that the graph crosses the y=0.5 ordinate at approximately t = 1.4.
b) Calculate the above value by solving the equation 0.5=1-e^(-0.5*t)
To improve on the accuracy of our answer from part a) we can solve the equation V=0.5 i.e.
1-e^(-0.5*t)=0.5
Subtracting 1 from both sides
-e^(-0.5*t)=-0.5
Multiplying both sides by -1
e^(-0.5*t)=0.5
Taking the log base e of both sides (and using the fact that the log base e is the inverse function of the exponential function)
-0.5*t=ln(0.5)
From a calculator ln(0.5) = -0.6931471 (to 7 decimal places)
so
-0.5*t=-0.6931471
Multiplying both sides by -2 gives
t=1.3862944
Which agrees with our result from part a) i.e. t is approximately 1.4.
Another way to get a solution to the equation 1-e^(-0.5*t)=0.5 is to write the equation in the form f(t)=0 and use plotXpose zero finding mode.
1-e^(-0.5*t)=0.5 <=> 1-e^(-0.5*t)-0.5 =0 (we have subtracted 0.5 from both sides)
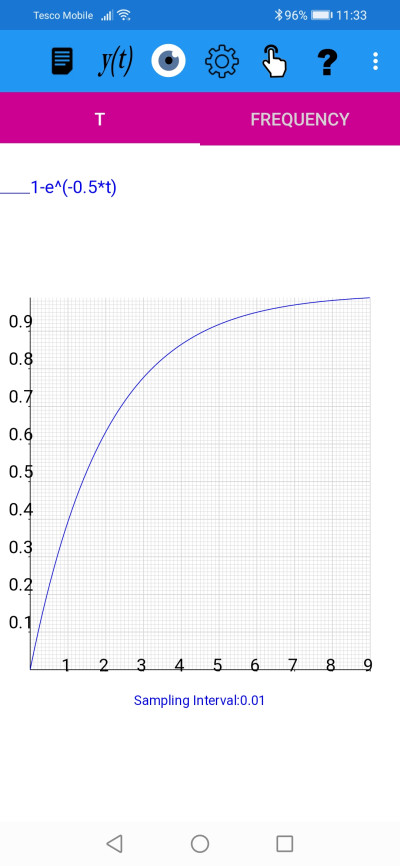
We plot the function f(t) = 1-e^(-0.5*t)-0.5
f(t) = 1-e^(-0.5*t)-0.5
Note this is equivalent to translating our original graph by 0.5 units downwards.
Note this is equivalent to translating our original graph by 0.5 units downwards.
We now want to find the value of t where this function crosses the t axis, i.e. where y=0.
On the plotXpose app Tap the Mode icon and the mode pop-up menu appears. Tap Zero Finding and increase the Accuracy to 10 significant figures. Tap OK and then tap on the t-axis near where the graph crosses the axis. We get the result something like the following:
Solving 1-e^(-0.5*t)-0.5=0: Success. The Newton-Raphson method has converged to the value
(1.386294361,0.0000000000E+000).
The sequence of values found was
( n, t , y(t))
(0, 1.5098038912, 2.99432963968E-002)
(1, 1.3824009793, -9.74293474066E-004)
(2, 1.386290574, -9.46787809486E-007)
(3, 1.3862943611, -8.96394070082E-013)
(4, 1.3862943611, 0.00000000000E+000)
(5, 1.3862943611, 0.00000000000E+000)
This gives the value of t as 1.386294361 to 10 significant figures.
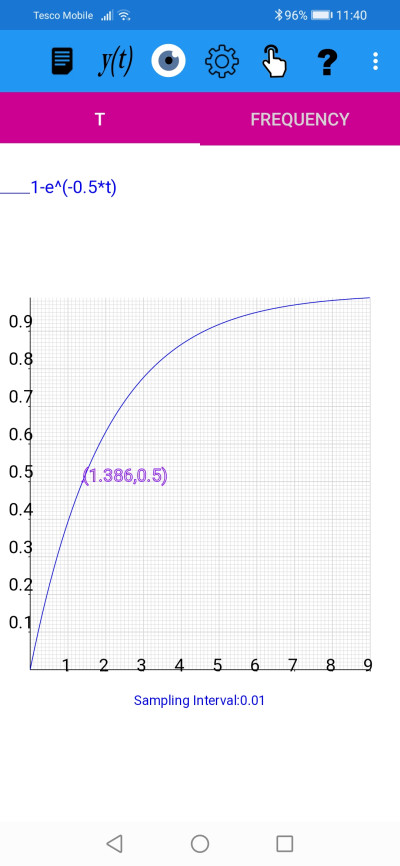
Finally we can double check that the value is consistent with our original graph, i.e. where the graph crossed the line V=0.5, by using the 'Display Position' mode, with a value of t=1.38629
'Display Position' mode, with a value of t=1.38629,confirms that V=0.5
c) To find a relationship between any value of the time constant and the corresponding time taken to reach half the maximum voltage we need to solve
Vo*(1-e^(-t/(R*C)))=0.5Vo
Divide both sides by Vo
(1-e^(-t/(R*C)))=0.5
Subtracting 1 from both sides
-e^(-t/(R*C))=-0.5
Multiplying both sides by -1
e^(-t/(R*C)=0.5
Taking the log base e of both sides (and using the fact that the log base e is the inverse function of the exponential function)
-t/(R*C)=ln(0.5)
From a calculator ln(0.5) = -0.6931471 (to 7 decimal places)
so
-t/(R*C)=-0.6931471
Multiplying both sides by -(R*C) gives
t=0.6931471*R*C
plotXpose app is available on Google Play and App Store
Google Play and the Google Play logo are trademarks of Google LLC.
A version will shortly be available for Windows.
A version will shortly be available for Windows.
plotXpose app is a companion to the book Mathematics for Electrical Engineering and Computing by Mary Attenborough, published by Newnes, 2003.


