The Golden Ratio - Solution
The golden ratio is found from the limit, as n tends to infinity, of the ratio of two successive terms of the Fibonacci sequence: x(n)=x(n-1)+x(n-2).Divide the recurrence relation by x(n-1) and setting r(n)=x(n)/x(n-1) we get r=1+1/r.
Solve this equation using the quadratic formula, using Newton-Raphson and using another fixed point method.
To solve this equation, where r!=0, we multiply both sides of the equation by r to get r^2=r+1
and subtracting r+1 from both sides we get
r^2-r-1=0
Solutions of a quadratic equation of the form ax^2+bx+c=0
are given by
x= (-b+/- sqrt(b^2-4ac))/(2a)
Here a=1, b=-1 c=-1 giving
r=(1+/-sqrt((-1)^2-4*1*(-1)))/(2)
=(1+/-sqrt(5))/2
We only look for the positive solution in this case giving
(1+sqrt(5))/2 = 1.6180339887499 to 14 s.f.
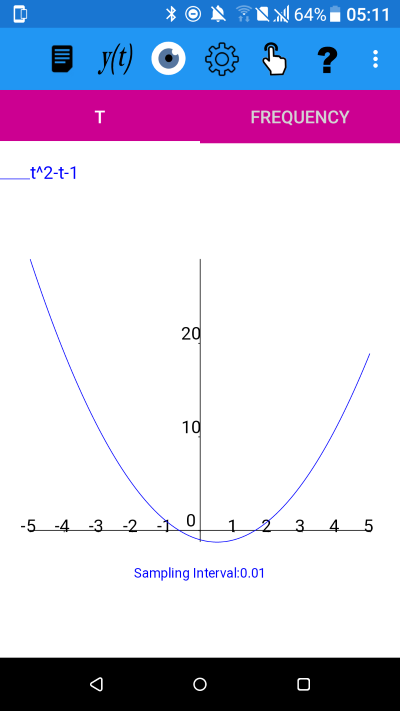
To solve using Newton-Raphson we plot the graph of y=t^2-t-1 using plotXpose.
Graph of y=t^2-t-1
Tap on the 'Mode' icon and then on the submenu (⋮) and select 'Zero Find'. Change the Accuracy (No. of s.f.) to 14 and tap OK. You will get the message popup "Click on the t-axis" and after tapping OK on this popup then click once on the t-axis in the vicinity of where the graph crosses the t-axis. After performing the zero-finding plotXpose will display the result and the sequence of values found during the calculation. An example output is below, where Newton- has calculated the solution as 1.6180339887499 to 14 significant figures.
Solving t^2-t-1=0: Success. The Newton-Raphson method has converged to the value (1.6180339887499,0.00000000000000E+000).
The sequence of values found was
( n, t , y(t))
(0, 1.79738557338715, 4.332093260330936E-001)
(1, 1.63043083960585, 2.787388313198380E-002)
(2, 1.61810196367846, 1.520011816329436E-004)
(3, 1.61803399081616, 4.620309912439780E-009)
(4, 1.61803398874989, 0.000000000000000E+000)
(5, 1.61803398874989, 0.000000000000000E+000)
(6, 1.61803398874989, 0.000000000000000E+000)
To solve using an alternative fixed point method we can use the expression we started from above for the ratio, i.e. r=1+1/r.
Again we tap on the 'Mode' icon and then on the submenu (⋮) and select 'Zero Find' and this time select the Fixed Point method radio button and tap on 'fix(t)=?' to enter the fixed point function to use. Enter fix(t) as 1+1/t and then tap on OK.
You will get the message popup "Tap on the t-axis" and after tapping OK on this popup then tap once on the t-axis in the vicinity of where the graph crosses the t-axis. After performing the zero-finding plotXpose will display the result and the sequence of values found during the calculation. An example output is below, where the solution has been calculated once again to 1.618033988749925 to 14 significant figures.
Solving t^2-t-1=0: Success. The Fix point method, using function 1+1/t has converged to the value (1.6180339887499,-8.88178419700125E-016).
The sequence of values found was
( n, t , y(t))
(0, 1.64488017559052, 6.075061646016877E-002)
(1, 1.6079470193876, -2.245340223014103E-002)
(2, 1.6219110380769, 8.684377358790574E-003)
(3, 1.61655662765925, -3.301297230213773E-003)
(4, 1.61859880618472, 1.263289197872552E-003)
(5, 1.61781832297106, -4.821968301687019E-004)
(6, 1.61811637672859, 1.842319086773347E-004)
(7, 1.61800252094459, -7.036316153685718E-005)
(8, 1.61804600861573, 2.687738157280961E-005)
(9, 1.61802939760379, -1.026609370491372E-005)
(10, 1.61803574241664, 3.921321116706622E-006)
(11, 1.61803331890953, -1.497808139294676E-006)
(12, 1.61803424460625, 5.721122744439811E-007)
(13, 1.61803389102148, -2.185273741961424E-007)
(14, 1.61803402607883, 8.347003976894030E-008)
(15, 1.61803397449151, -3.188271668896903E-008)
(16, 1.61803399419611, 1.217811407272507E-008)
(17, 1.61803398666962, -4.651625307161567E-009)
(18, 1.61803398954449, 1.776762736938053E-009)
(19, 1.61803398844639, -6.786633477418036E-010)
(20, 1.61803398886582, 2.592264181089377E-010)
(21, 1.61803398870561, -9.901568454040444E-011)
(22, 1.61803398876681, 3.782063551227566E-011)
(23, 1.61803398874343, -1.444622199642254E-011)
(24, 1.61803398875236, 5.518252521596878E-012)
(25, 1.61803398874895, -2.108091479158247E-012)
(26, 1.61803398875026, 8.055778266680136E-013)
(27, 1.61803398874976, -3.077538224260934E-013)
(28, 1.61803398874995, 1.172395514004165E-013)
(29, 1.61803398874987, -4.440892098500626E-014)
(30, 1.6180339887499, 1.687538997430238E-014)
(31, 1.61803398874989, -6.661338147750939E-015)
(32, 1.6180339887499, 2.442490654175344E-015)
(33, 1.61803398874989, -8.881784197001252E-016)
plotXpose app is available on Google Play and App Store
Google Play and the Google Play logo are trademarks of Google LLC.
A version will shortly be available for Windows.
A version will shortly be available for Windows.
plotXpose app is a companion to the book Mathematics for Electrical Engineering and Computing by Mary Attenborough, published by Newnes, 2003.


